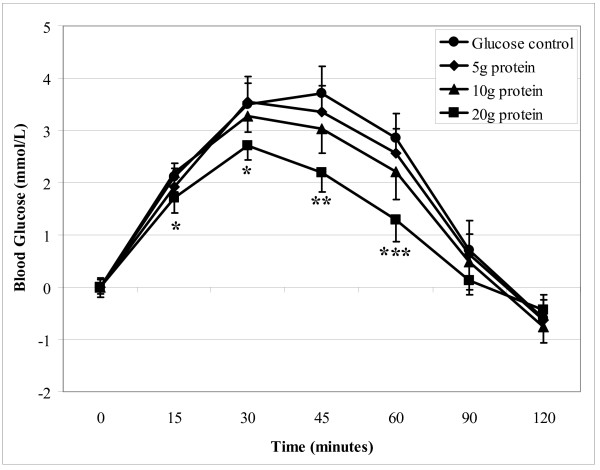
Figure 1.
Incremental blood glucose response after meals containing either glucose alone (control), or glucose plus either 5, 10 or 20 g of protein from GILP. Data are expressed as Mean ± SEM. * 20 g GILP meal significantly different from control, ** 20 g GILP different from 5 g GILP and control, *** 20 g GILP different from all meals using GLM ANOVA and adjusted for multiple pair-wise comparisons with the Tukey-Kramer test (p < 0.001).

