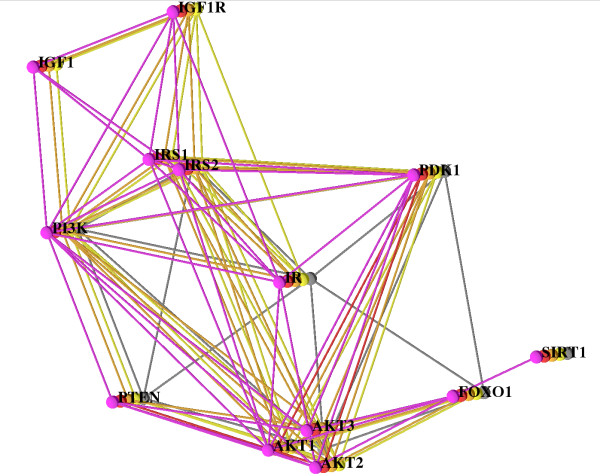
Figure 2.
The Insulin/IGF1 Pathway. Alignment of human (pink), chimpanzee (red), mouse (orange), rat (yellow), and fly (gray). The layout is computed using our simulated annealing algorithm. All five species are shown and all paralogs (AKT1,2,3 and IRS1,2), too. For a better overview only the human network is labeled.

