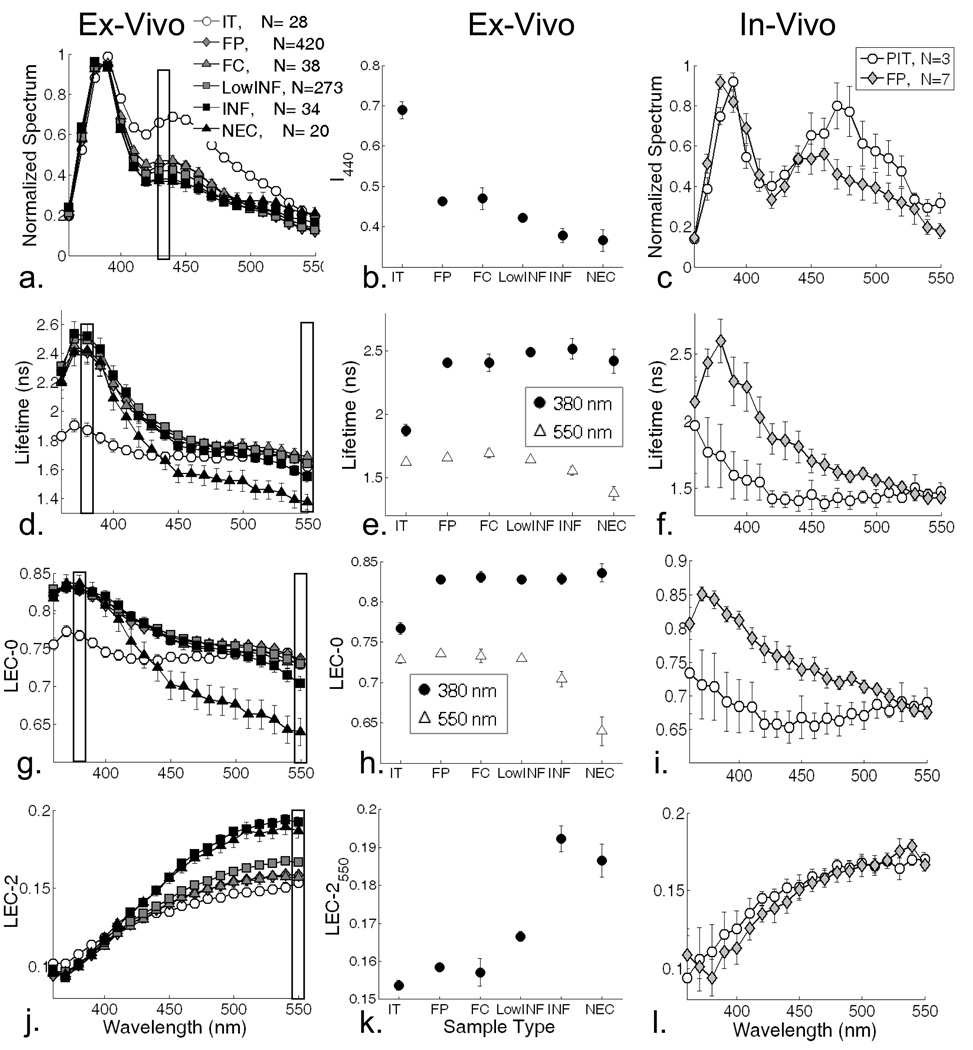
Figure 3.
Left panels: Spectroscopic parameters as a function of emission wavelength derived from the time-resolved spectra measured in ex vivo samples. Middle panel: statistical group comparisons (mean ± SE) for specific wavelengths – data corresponding to measurements ex vivo. Right panels: Spectroscopic parameters as a function of emission wavelength derived from the time-resolved spectra measured in vivo. Spectroscopic parameters: normalized intensity (a), (b), (c), average lifetime (d), (e), (f), LEC-0 (g), (h), (i), and LEC-2 (j), (k), (l).

