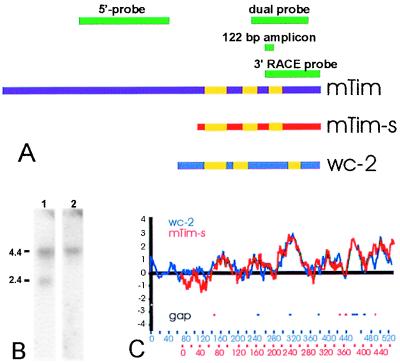
Figure 5.
mTim molecular analysis. (A) Location of probes used in these studies and overview of Tim/mTim-s sequence comparison. (B) Isoform-specific probes. Northern blot analysis with a probe predicted in this model (dual probe) to have dual specificity indeed detects both isoforms (lane 1) whereas a 5′-specific probe detected only the 4.4-kb isoform (lane 2). (C) Hydrophilicity database search using mTim-s as seed query (http://bioinformatics.weizmann.ac.il). The hydrophilicity profiles of mTim-s and WC-2 are highly similar. Yellow bars in A correspond to regions of >40% amino acid similarity between mTim-s and WC-2.

