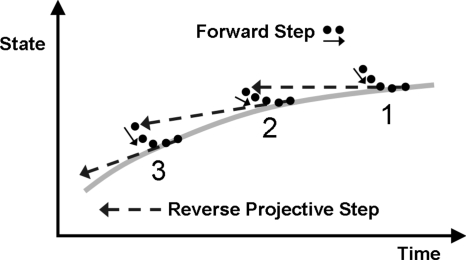
Figure 1.
Schematic of reverse projective integration. The thick gray line indicates the position on the slow manifold as a function of time on a forward trajectory. The solid circles are configurations along microscopic trajectories run forward in time, as indicated by the short solid arrows. The long dashed arrows indicate the reverse projective steps, which result in an initialization near, but slightly off, the slow manifold.

