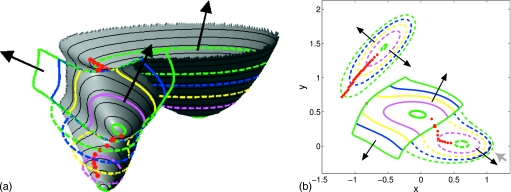
Figure 11.
Potential stepping on Müller–Brown potential with ΔV=0.75 and N=160 [successive (colored) rings are shown at intervals of 30 steps]. Positions (red circles) of the minimum in gradient norm along the ring are shown at intervals of five steps in ring integration. Two different viewpoints of the same ring evolution are shown (consistent coloring of rings in each viewpoint). Black arrows indicate the direction of ring evolution out of each minimum. Left: Three-dimensional (3D) view; right: 2D overhead view (gray arrow indicates position of 3D view shown left).

