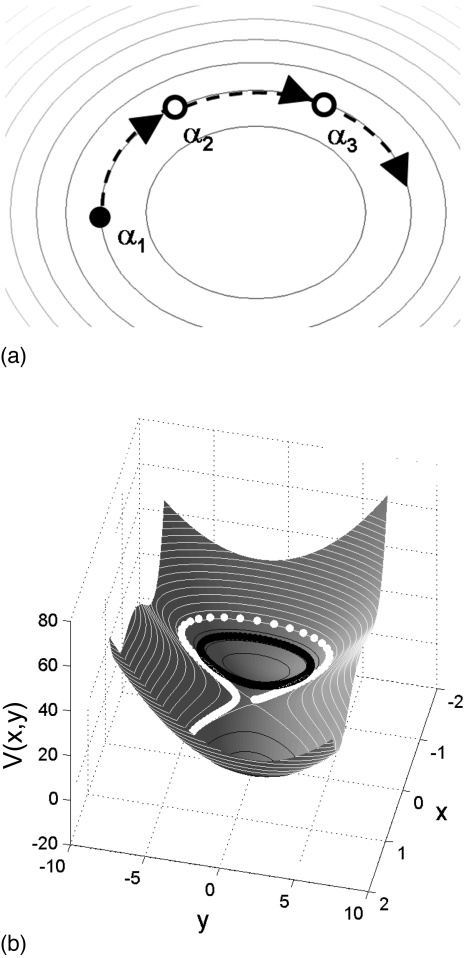
Figure 4.
Distribution of nodes produced by integration of Eq. 2.3 with initial condition above (white nodes and contour lines) and below (black nodes and contour lines) the saddle point energy. Below the saddle point there is a separation of isopotential contours in each well—the saddle point isopotential contours split into two.

