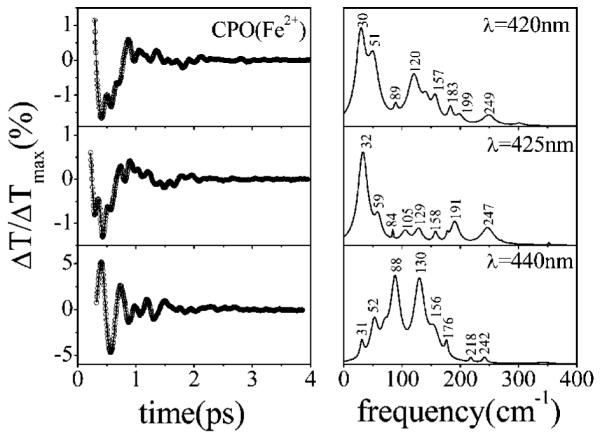
Figure 7.

Open band measurements of reduced CPO at pH 5. The left panels show the oscillatory signal (○) and their LPSVD fits (—). The right panels present the corresponding LPSVD-generated power spectra. Experiments were carried out with ~60 fs pulses at 420, 425, and 440 nm. The increase in the relative amplitude of the oscillatory signal as well as changes in the pattern of frequencies should be noted as the excitation wavelength is tuned to 440 nm.
