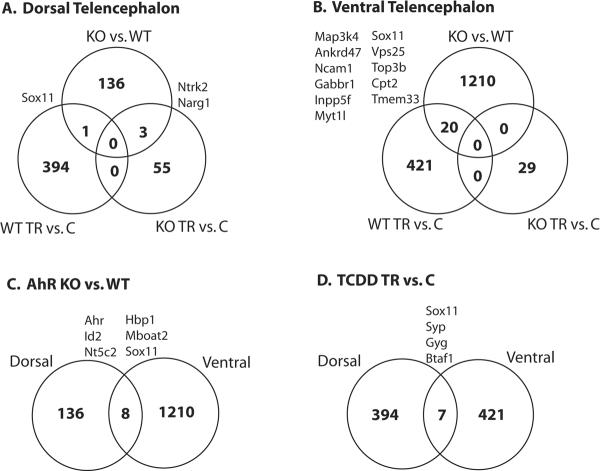
Figure 2. Venn diagram of global gene expression analysis results in dorsal (A.) and ventral (B.) telencephalon.
KO refers to AhR -/-, WT refers to wildtype (AhR +/+), TR refers to treatment of TCDD on GD 11.5, and C refers to vehicle control group. Each circle reports the number of differentially expressed genes (p value < 0.001 and fold change greater than 1.2) within each comparison and the overlap between each comparison.

