
Fig. 5.
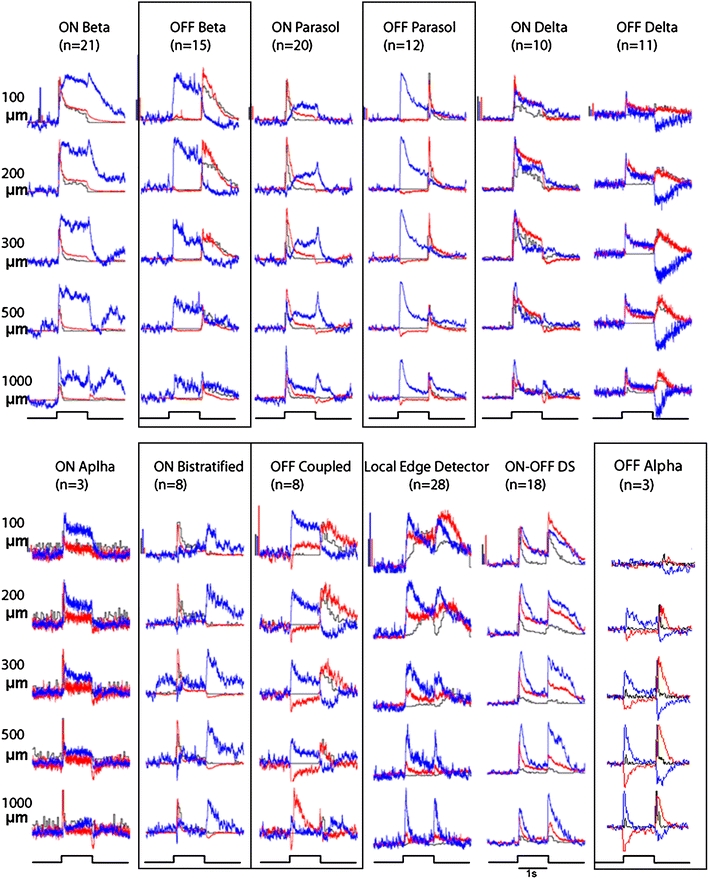
Spatio-temporal responses of various Ganglion cell types to bright spots of diameter 100 μm, 200 μm, 300 μm, 500 μm, and 1000 μm (Roska et al. 2006). Each row is a given size, each column is a cell type. Average conductance for each cell type is shown (conductance is used rather than current to allow comparison of synaptic inputs in a compact format): red is excitation, blue is inhibition, scale bars are 1.6nS. Black is spiking (scale bar is 50spike/s), Responses enclosed in boxes are examples that show crossover inhibition. Note that the maximum amplitude of excitation and crossover inhibition occur for the same size spots