
Figure 3.
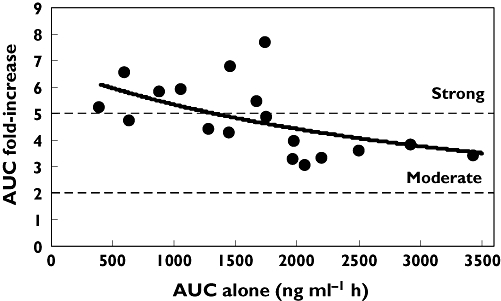
Scatter plot of baseline sotrastaurin AUC vs the fold-change in AUC in the presence of ketoconazole. Shown is a trendline based on a standard Imax inhibitory model (r2= 0.30). Demarcated is the fold-change for a moderate interaction (≥2-fold) and a strong interaction (>5-fold)