
Figure 3.
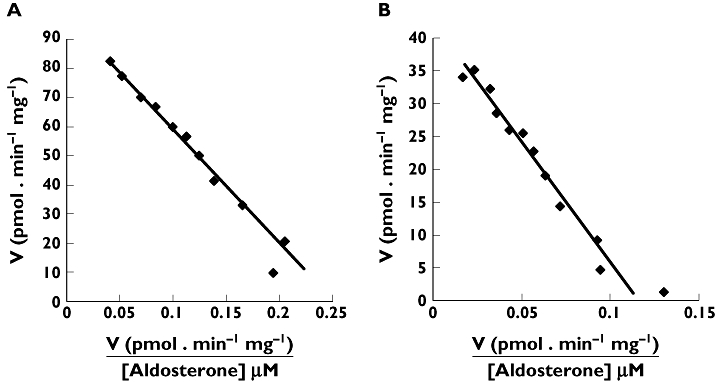
Eadie-Hofstee plots for aldosterone 18β-glucuronidation by recombinant A) UGT1A10 and B) UGT2B7. Points are experimentally determined values, while the solid lines are model fitted curves of best fit
Official websites use .gov
A
.gov website belongs to an official
government organization in the United States.
Secure .gov websites use HTTPS
A lock (
) or https:// means you've safely
connected to the .gov website. Share sensitive
information only on official, secure websites.
Eadie-Hofstee plots for aldosterone 18β-glucuronidation by recombinant A) UGT1A10 and B) UGT2B7. Points are experimentally determined values, while the solid lines are model fitted curves of best fit