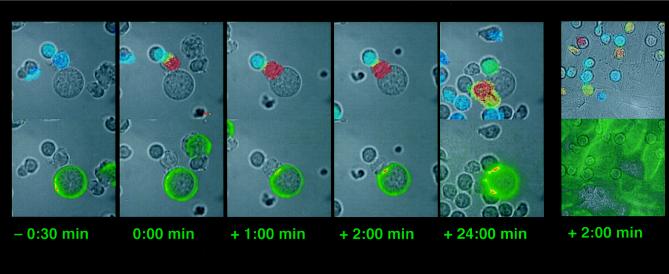
Figure 1.
Mobilization of ICAM-1/GFP during T cell recognition of B cells and MHC II-transfected CHO cells. Each panel consists of two identical bright-field images. The upper one is overlaid with a transparent color scale of the ratio of the fluorescence emissions at 340 nm and 380 nm of the calcium sensitive dye Fura-2. This ratio is correlated with the intracellular calcium concentration. Blue indicates low, resting calcium; and red, high calcium. The bottom bright-field image is overlaid with a transparent color scale of the GFP fluorescence. Green indicates low ICAM-GFP concentration, yellow medium, and red high. The five left panels show a time course for the interaction of a T cell with a B cell. Time points of the interaction are given with the time before or after activation indicated below each panel. The second T cell activating on the central B cell is slightly above the plane of focus of the objective; thus the recorded GFP fluorescence is reduced. The sixth panel at the right shows the activation of T cells by an I-Ek-transfected CHO cell 2 min after the activation of the middle T cell. The movies from which these photos are derived can be viewed at http://cmgm.stanford.edu/hhmi/mdavis.

