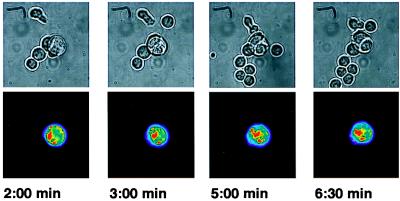
Figure 2.
Capturing the T/B cell interface in a different orientation. Two T cells, activated by one ICAM-1-transfected CH27 B cell, are shown. The T cells have moved under the larger CH27 cell after activation, with the result that the focal plane of the microscope is now at the B/T cell interface (versus the side view of Fig. 1). One cell lies under the top left part of the CH27 cell, the other under the bottom right part. The other T cells in the images are not activated. In the upper row are bright-field images, in the bottom row the ICAM-1/GFP fluorescence images. The fluorescence intensity is encoded in a rainbow color scheme, which represent linear variations in intensity, because the images have been collected with a cooled CCD camera. The time after the activation of the bottom right cell is indicated below each panel. The top left cell has activated 7 min before this. T cell activation was determined by monitoring the intracellular calcium concentration (data not shown).

