
Fig. 4.
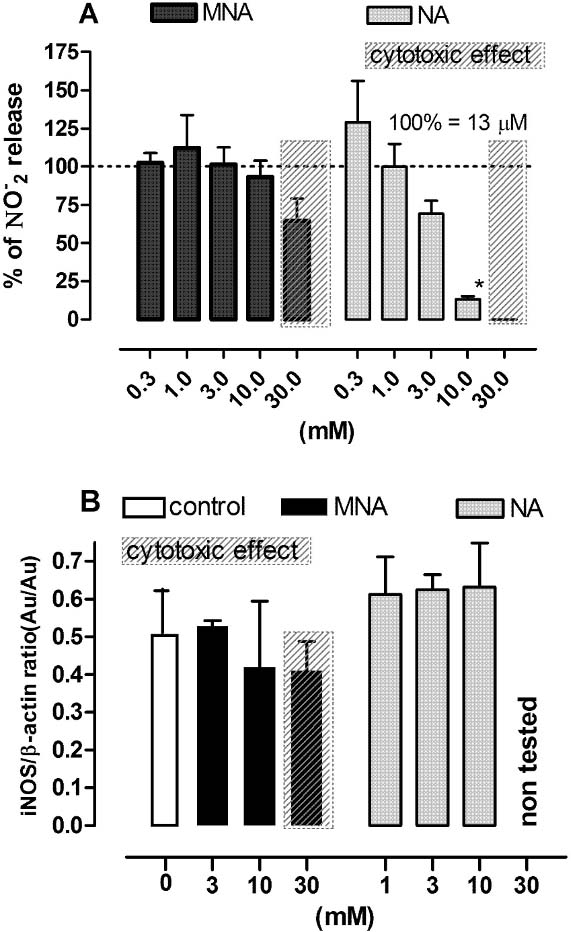
Effect of MNA and NA on the production of NO and iNOS expression by LPS plus IFN-γ-stimulated Mϕ. Cells stimulated with LPS (100 ng/ml) and IFN-γ (50 U/ml) were exposed to MNA and NA in the culture medium for 24 h and then both the medium and the cells were collected for further assay. A — the release of nitrites (NO−2); the results are expressed as the percentage of the (NO−2) production by control Mϕ ±SEM. Data were calculated from three separate experiments. B — the expression of iNOS; the data are normalized to constitutively expressed β-actin protein ±SEM. Densitometric analysis of bands from two independent experiments. *p<0.05.