
Figure 4.
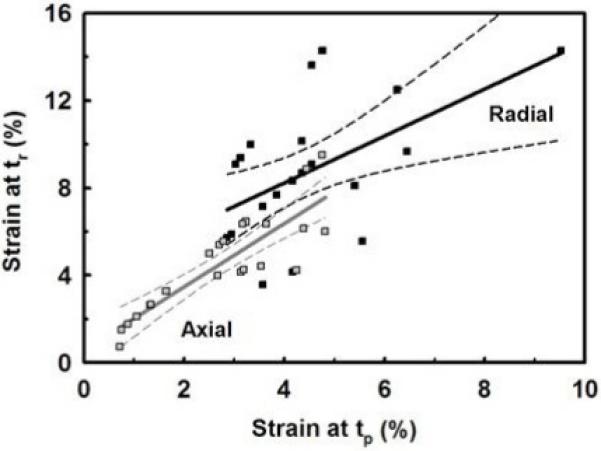
Plot of the fiber’s axial (εl  ) and radial (εd ■) strains at the end of the mechanical-elongation (tp) and mechanical stress-relaxation (tr) phases. The radial strain was always greater then the axial strain at both times. After mechanical stress-relaxation both strains increased significantly. The best-fit linear model ± 95% confidence interval is shown.