
Figure 2.
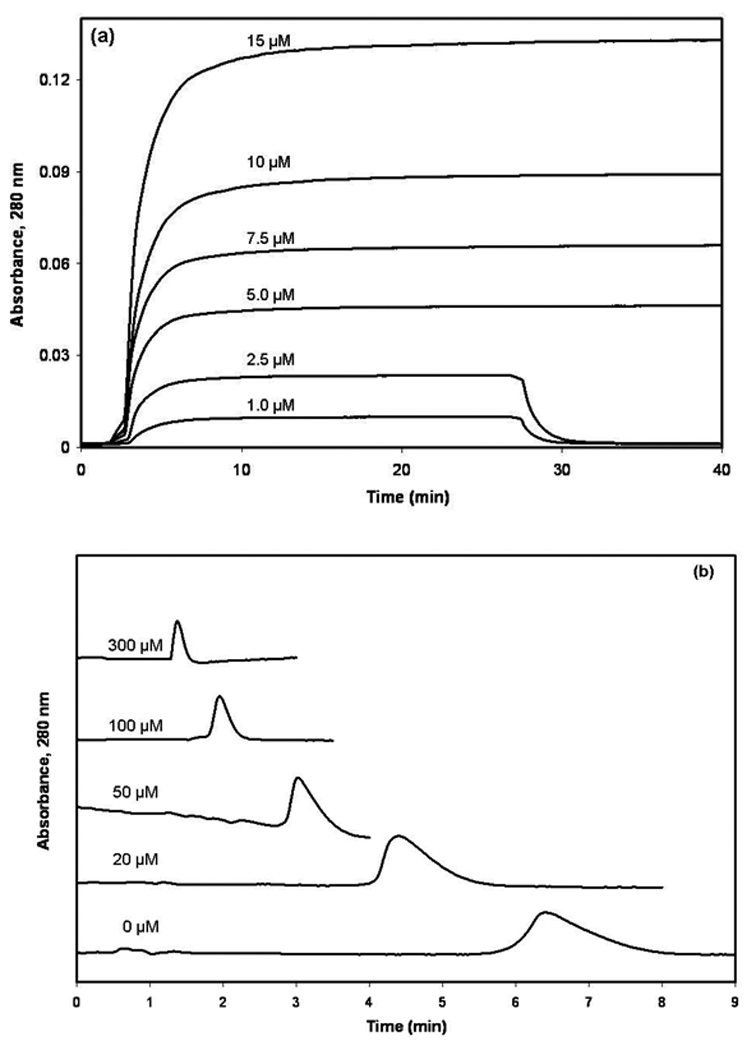
(a) Typical breakthrough curves seen during the frontal analysis studies that were performed for this report and (b) typical results obtained during the zonal elution studies examining the competition of a probe candidate with L-tryptophan. The concentrations that are shown by these curves represent (a) the applied concentration of 3-acetylindole or (b) the concentrations of L-tryptophan in the mobile phase. All other conditions are given in the text.