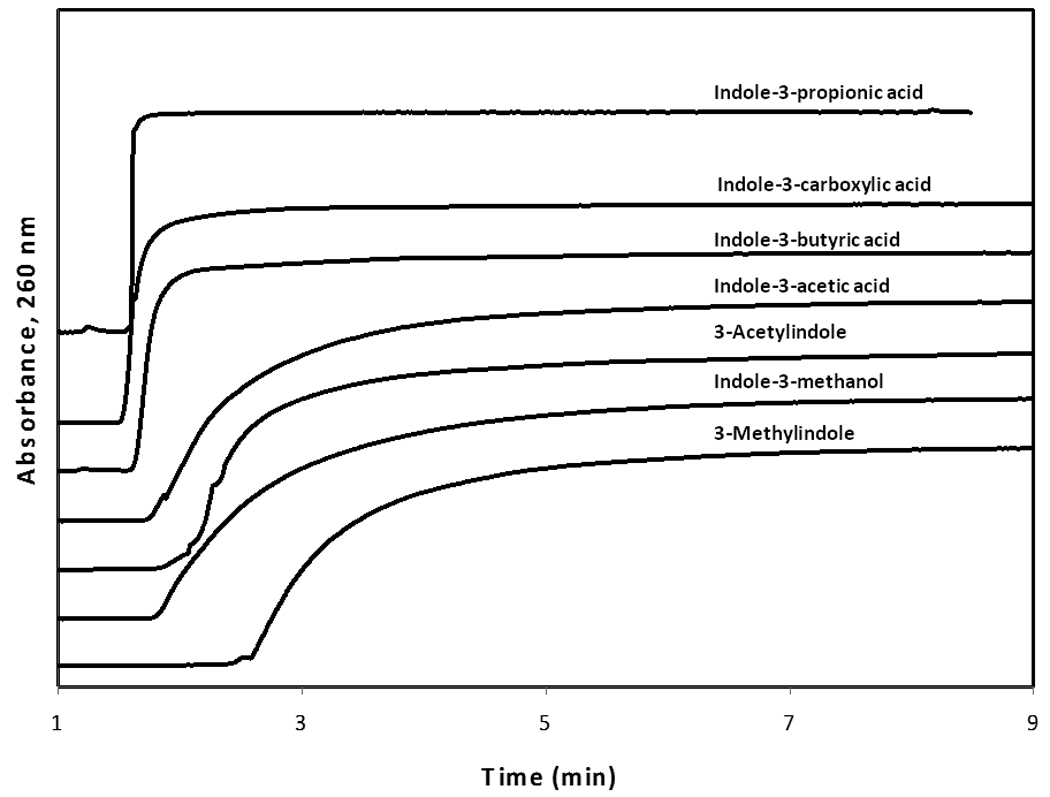
Figure 5.

Non-specific binding by each of the probe candidates on the control column at an applied concentration of 5 µM. For the sake of comparison, the response on the y-axis has been normalized for each probe candidate to correct for differences in their molar absorptivities at the detection wavelength and to give them breakthrough curves with equivalent plateau values.
