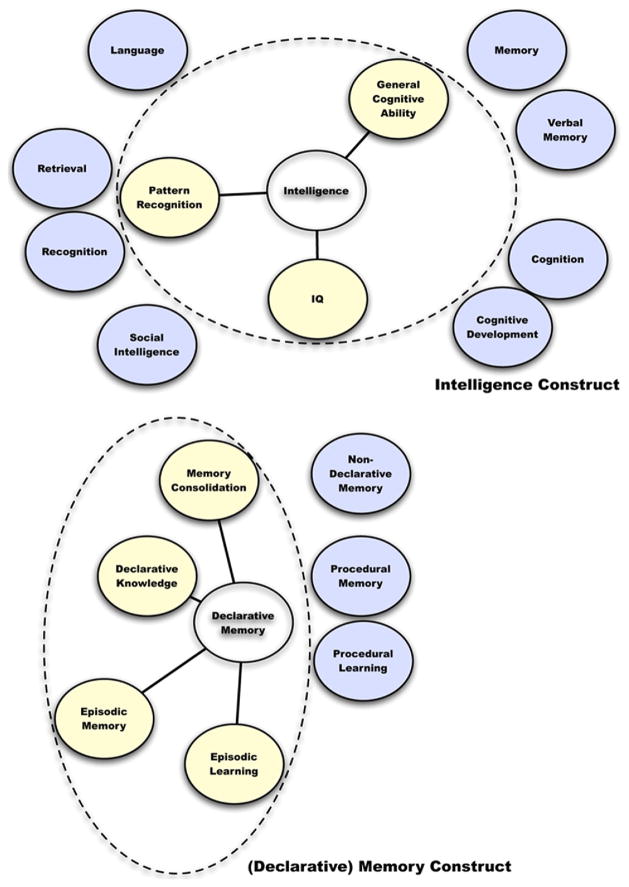
Fig. 2.
Phenotype construct maps. Graphical depictions of our enriched concept phenotype definitions. Distance from the center suggests co-occurrence strength. Dotted line represents concepts chosen to define the construct. Blue circles represent other frequent concepts that were not included in our phenotype definition.

