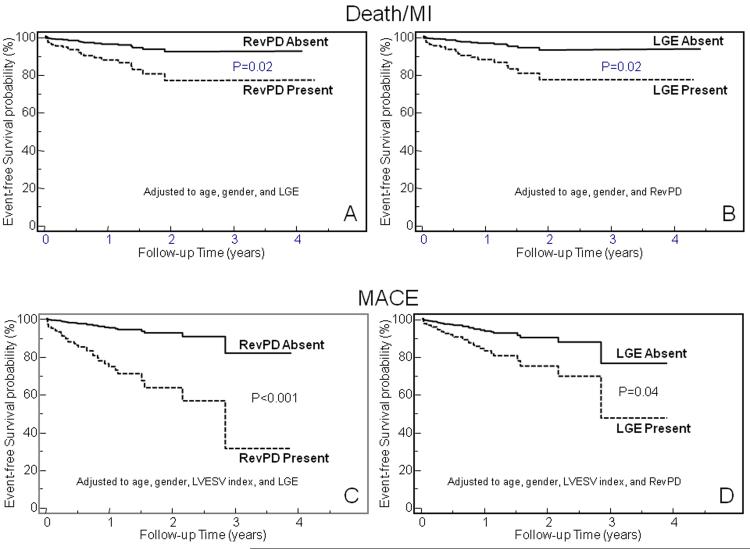
Figure 3.
Adjusted Kaplan-Meier curves for Death/MI (top) and MACE (bottom) stratified by RevPD and LGE, respectively. Adjusted to the effects of age, gender, and LGE, RevPD maintained strong association with Death/MI(A) and MACE(C), respectively. On the other hand, adjusted to the effects of age, gender, and RevPD, LGE maintained significant association with Death/MI(B) and MACE(D), respectively. Note that for association with MACE, LVESV index was also entered into the model for effect adjustment.

