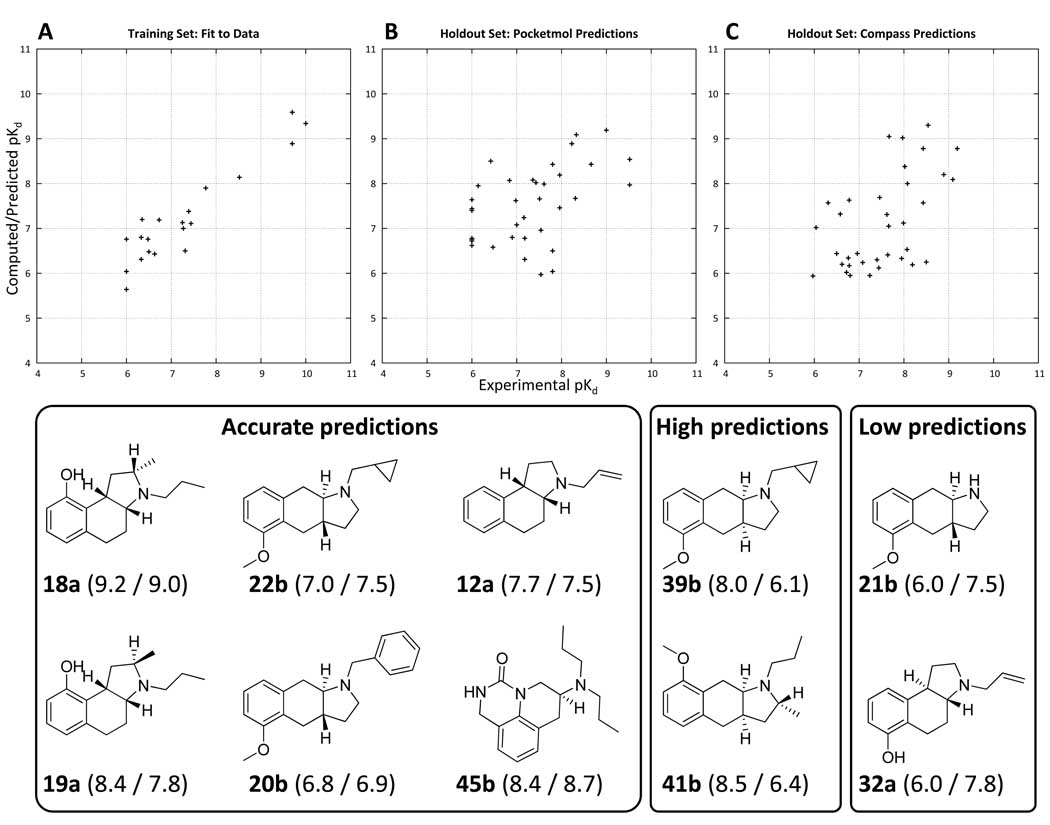
Figure 9.
Plots of experimental (X-axis) versus computed/predicted pKd for the final optimized binding pocket for the 20 molecule training set (Panel A) and the 35 molecule holdout set (Panel B). Predictions from Compass on the same holdout set (using the same training molecules) are shown in Panel C. Mean error of fit for the training set was 0.4 pKd units. Prediction error on the 35 molecule holdout set was 0.8 units, with a Kendall’s tau rank correlation of 0.34 (p < 0.01 by permutation). The Compass predictions had a mean error of 0.6 units, with a Kendall’s tau rank correlation of 0.36 (p < 0.01 by permutation). The differences between the prediction quality for the pocketmol and for Compass were not statistically significant. However, the pocketmol predictions tended to be high for inactive molecules, and the Compass predictions were low for mid-range actives, apparently reflecting a significant difference in the bias of the learning approaches. Examples of structures with accurate, low, and high predictions from the pocketmol are shown (predicted/actual pKd are shown in parentheses with molecule names). Note: there is a slightly negative but insignificant correlation between molecular weight and pKd for the 35 holdout molecules.

