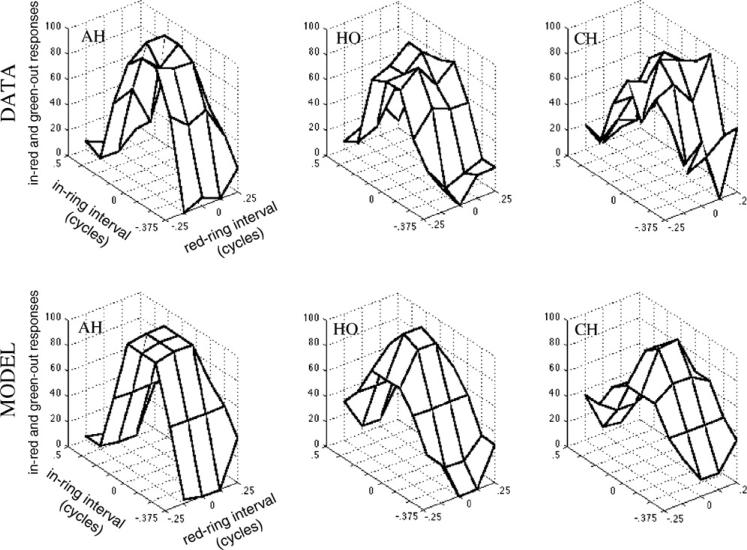
Fig. 7.
Top row is data (collapsed as shown in Fig. 6) from Experiment 2 showing the percent in → red or green-out responses as a function of the ring timing relative to the color and motion, for three observers. The data form a hill shape, with the position of the peak close to the origin, indicating little to no asynchrony between ring, color, and motion (Table 1).

