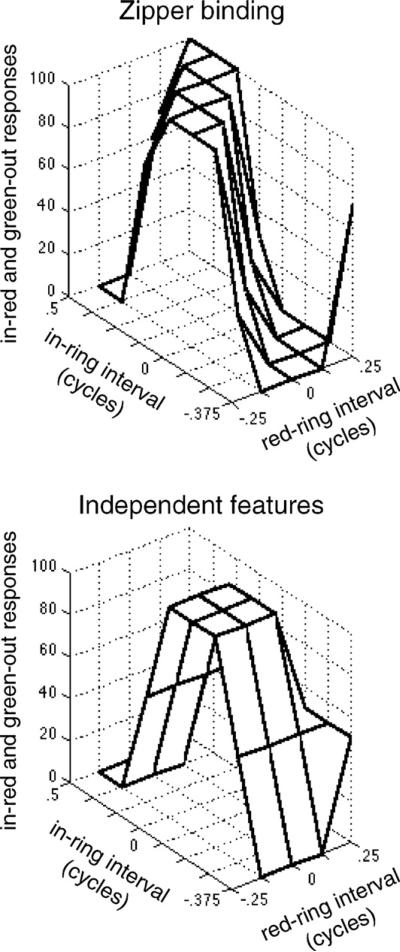
Fig. 8.
(Top) The prediction of the zipper binding model is that the data will form a diagonal ridge. Position of the ridge is determined by the relative latency of the color and motion (the pictured position corresponds to a motion latency of 150 ms). (Bottom) The independent features model predicts a single peak corresponding to when the ring cued a single feature on each dimension. As the ring diverges from this point and increasingly cues multiple features on each dimension, performance declines. Center of the peak indicates optimal red → ring interval and in → ring interval, pictured with both assumed to be 0.

