
Figure 4.
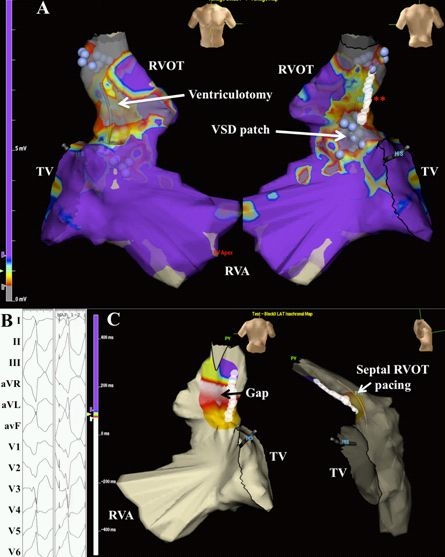
Voltage and pace mapping of ventricular tachycardia in tetralogy of Fallot. In Panel A, a color-coded voltage map of the right ventricle in sinus rhythm is shown in a patient with tetralogy of Fallot and ventricular tachycardia. Values below 0.5 mV are depicted in grey and above 1.5 mV in purple. The presumed ventriculotomy incision and ventricular septal defect patch are indicated by the white arrows. In areas of low voltage, unipolar pacing at 10 mAmp/2 ms was performed. Unexcitable tissue was marked by blue spheres. Linear ablation (white circles at the double red asterisk) was performed connecting two unexcitable areas, i.e. pulmonary annulus and ventricular septal defect patch. TV denotes tricuspid valve; RVA, right ventricular apex; RVOT, right ventricular outflow tract. This site was selected for ablation following pace mapping of the septal RVOT, shown in Panel B. Bouts of non-sustained ventricular tachycardia were inducible, corresponding to documented sustained events. Left and right hand panels capture non-sustained ventricular tachycardia and successful 12-lead pace mapping, respectively. In Panel C, block was verified by pacing from a decapolar catheter septal to the ablation line and mapping local activation. Local activation times are color-coded from white to red, orange, yellow, green, light blue, dark blue, and purple. Early activation along the mid-portion of the RVOT adjacent to the ablation line suggests a conduction gap. Additional ablation was performed along the mid-portion of the line, until bidirectional block was achieved. Reproduced from Khairy P, Stevenson WG. Catheter ablation in tetralogy of Fallot. Heart Rhythm 2009;6(7):1069-74.71. Copyright (2009), with permission from Elsevier.