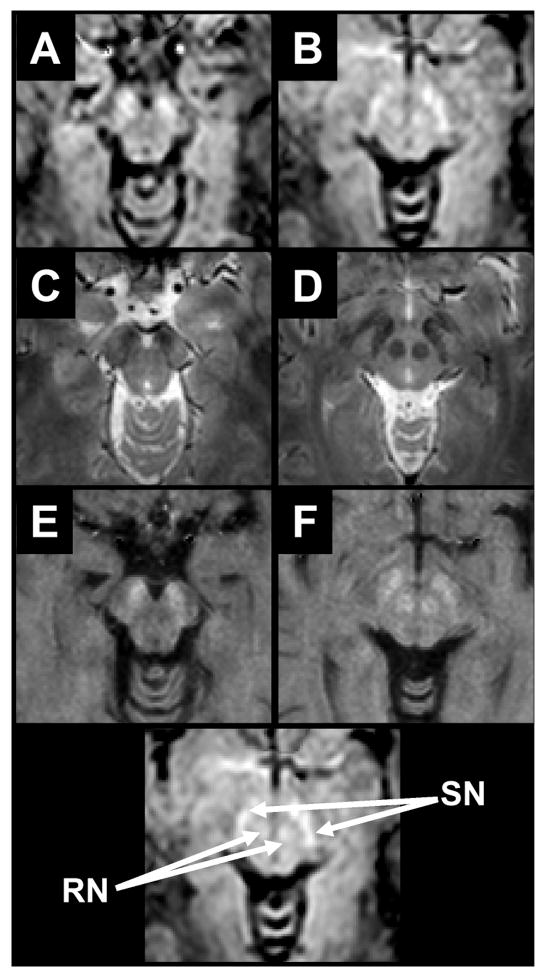
Figure 3.
Comparison of DSR (A-B), T2*-weighted (C-D), and absolute R2 (E-F) images. A location key is given at the bottom. For DSR, the contrast is similar to R2 in that regions of high iron concentration exhibit increased intensity. At the level of the brain stem the SN and RN can be seen in all three image types.

