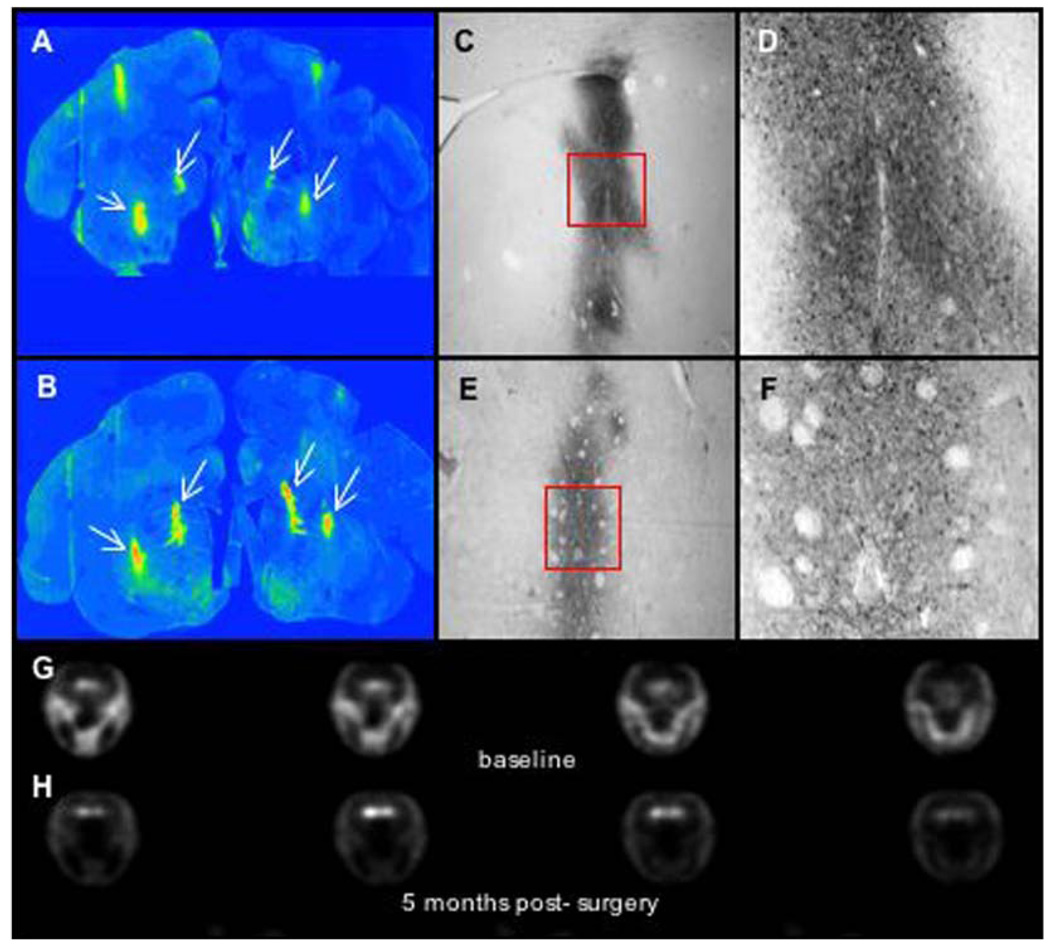
Fig. 3.
Immunostaining and PET imaging of AAV-AADC-treated monkey (TO11). (A, B) Low power photomicrographs of AADC-IR with focal AADC expression. One site in the caudate nucleus and 2 sites in the putamen were targeted bilaterally. Note very low levels of AADC in the striatum with exception of nucleus accumbens and focal regions (as indicated by arrows) of AADC gene transfer 6 months following AAV-AADC administration. (C–F) High power photomicrographs of the AADC-transduced regions in the caudate as shown in panels A and B. AADC expression is restricted to medium spiny neurons (expressing D1 and D2 receptors). Also note the very short distance of AADC-IR fibers extending from the focus of AADC transduction. Local DA production by AADC-expressing striatal neurons in response to l-dopa administration most likely represents focal DA production. l-dopa administration in these monkeys resulted in significant induction of dyskinesias (see clinical rating figures). (G–H) 6-[18F]fluoro-l-m-tyrosine (FMT) positron emission tomography (PET) before and approximately 4 weeks after AAV-AADC gene transfer. Three brain levels (anterior to posterior) are shown for baseline and post-gene transfer. Low levels of FMT activity were seen following AADC gene transfer due to limited expression of AADC in the striatum. Scale bar: 5 mm.

