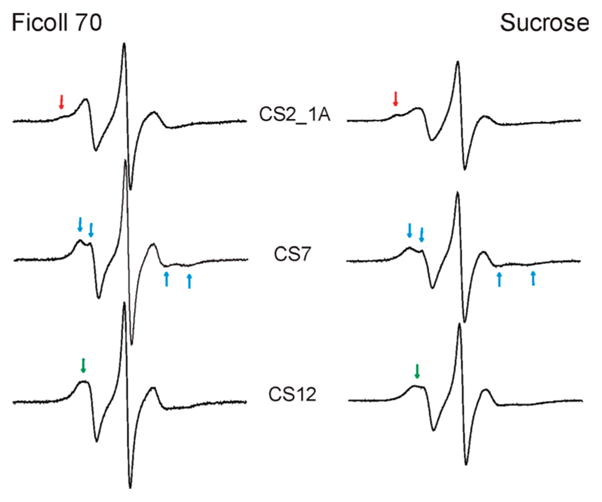
Figure 7.

R5a spectra obtained in different cosolvents. Spectra recorded in ~30% (w/w) Ficoll 70 are shown on the left, while the corresponding spectra recorded in 34%sucrose (w/w) are shown on the right. Arrows in the same color indicate spectral features that are maintained at the same site in two cosolvents.
