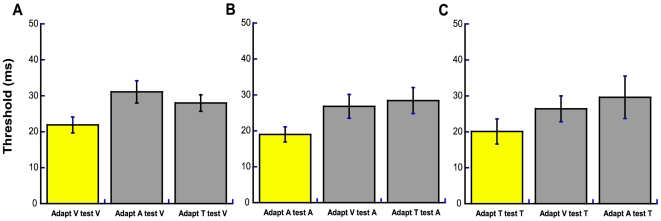
Figure 4. Sensitivity to changes in relative sensorimotor time.
Average threshold values (ms) from (A) visuo-motor, (B) audio-motor and (C) tactile-motor sensorimotor temporal order judgments following adaptation to a 200 ms delay between action and event. In each plot, yellow bars represent within-modality data taken from the 200 ms condition in Figure 2. Grey bars represent crossmodal data (e.g., adapt visuo-motor, test audio-motor). Error bars represent one standard error of the mean either side of the parameter values (n = 7).

