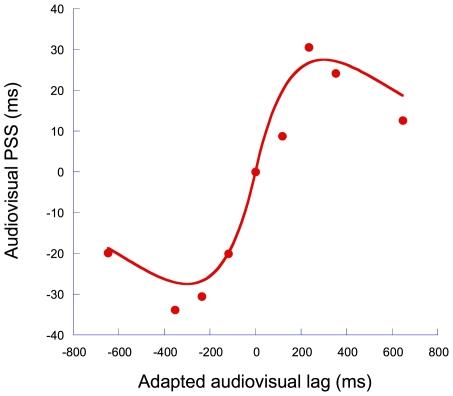
Figure 5. Adaptation to purely sensory asynchrony.
Data taken from Fujisaki at al. (2004) where observers adapted to a fixed level of asynchrony between auditory and visual stimulus pairs before judging the relative temporal relationship of audiovisual test pairs [7]. PSS values are plotted as a function of the size of the adapting asynchrony and are expressed relative to the ‘adapt synchronous’ condition. The data are fitted with a same model used to fit the sensorimotor data shown in Figure 2 (see main text for details).

