
Figure 3. 5’ and 3’ NFR sharing.
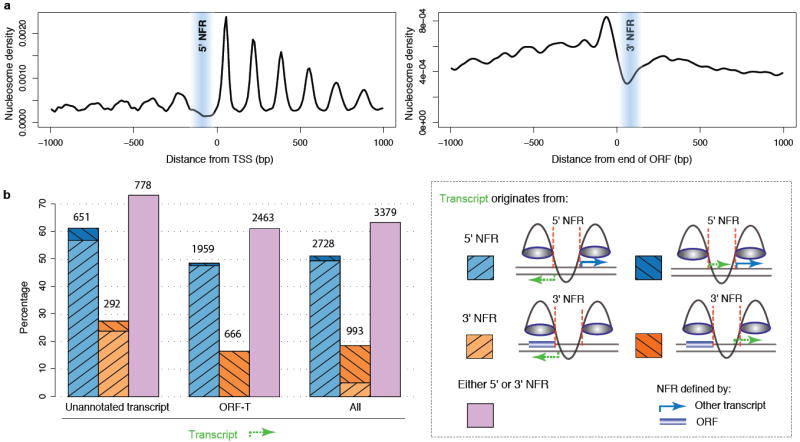
a, Nucleosome density relative to TSSs, averaged over all transcripts (left panel) and relative to translation stop sites, averaged over all ORF-Ts (right panel).
b, Transcripts initiating from 5’ or 3’ NFRs of other transcripts. The first block of bars corresponds to unannotated transcripts (1,063), the second to ORF-Ts (4,039), and the third to all transcripts (5,339) with mapped 5’ NFRs. Within each block, the bars correspond to different orientations of the transcript relative to the 5’ or 3’ NFR it originates from: divergently from a 5’ NFR (light blue), in tandem from a 5’ NFR (dark blue), in antisense to an ORF from a 3’ NFR (light orange), in tandem to an ORF from a 3’ NFR (dark orange), in any orientation from a 5’ or 3’ NFR (pink). See Supplementary Table 11 for a list of these pairs.