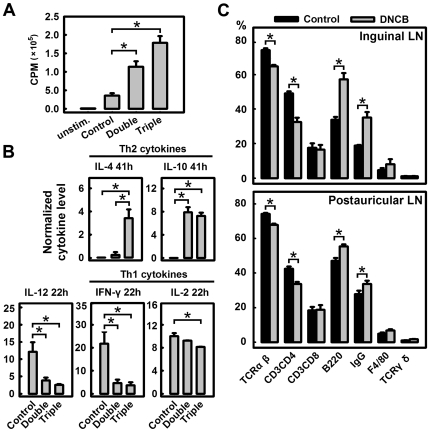
Figure 5. Skewing of Th cells in the Th2 direction following DNCB treatment.
A and B. Double DNCB sensitizations before challenge were applied on D0 and D12 as described in Figure 1A whereas triple sensitizations were applied on D0, D7 and D13 as in Figure 2A . Both groups received challenge on D17 and terminated a day later. A. Proliferation of lymphocytes as measured by using the [3H]thymidine incorporation assay. Lymphocytes were harvested from collected LNs and cultured in vitro under the stimulation of Con A at 5 µg/mL for 60 h. [3H]Thymidine was introduced for the final 14 h and the radioactivity (cpm) was measured using a Beta counter. * P<0.01 compared to the control group. Each value is the mean±S.D. (N = 4). B. Cytokine production by cultured lymphocytes. The supernatant from cultured lymphocytes was collected at 22 and 41 h, and assayed using ELISA for cytokine concentrations. The cytokine production levels were normalized according to the relative cell density (based on the radioactivity values from the cell proliferation assay). Each value is the mean±S.D. (N = 3). C. The population of various cell types (TCRβ+, CD3+CD4+, CD3+CD8+, B220+, IgG+, F4/80+, and TCRγδ+) in the inguinal and postauricular lymph nodes of control and DNCB-treated mice. In this experiment, the DNCB treatment regimen was the same as depicted in Figure 1A . * P<0.01 compared to the control group. Each value is the mean±S.D. (N = 6).

