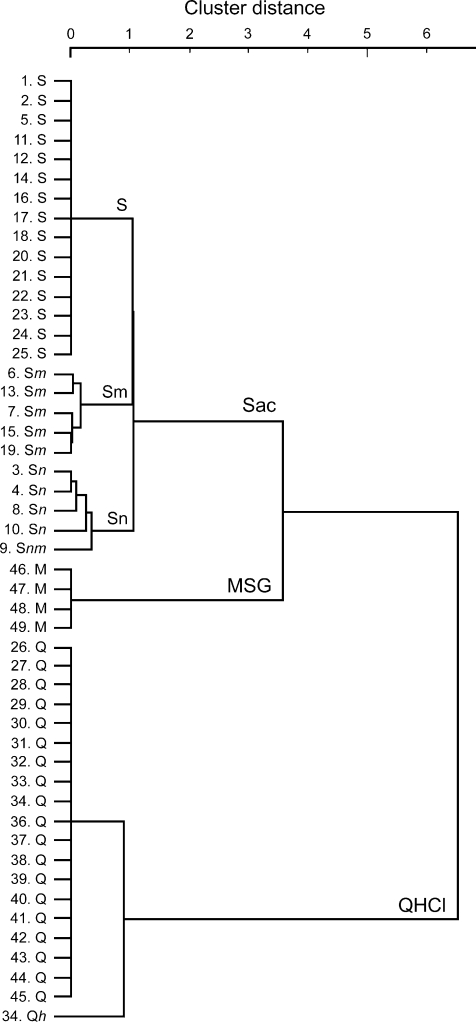
Figure 4. Cluster dendrogram showing the relationships among response profiles of gustducin-expressing taste cells.
The cell number and response profile of each cell is indicated on the left. Capital letters indicate the stimulus producing the maximum response (shown first) and all others with responses ≥50% of maximum. Lower-case letters indicate responses <50% of the maximum. The order of the letters indicates the relative magnitude of the response to each stimulus (S or s: Sac; N or n: NaCl; H or h: HCl, Q or q: quinine, M or m: MSG). The three clusters are labelled Sac, MSG and quinine according to the best stimulus. The Sac cluster is further divided into 3 groups, sweet specific (labelled S), sweet and salty (labelled Sn), sweet and umami (Sm).

