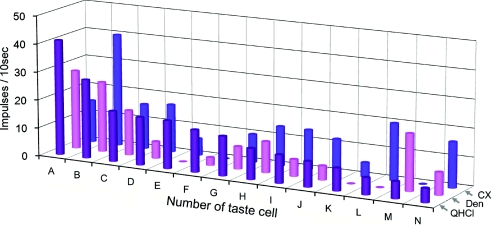
Figure 5. Bitter taste response profiles of 14 quinine sensitive taste cells.
Taste responses are shown of each taste cell to 20 mm quinine-HCl (QHCl), 20 mm denatnium (Den) and 0.1 mm cyclohexamide (CX). Bitter taste cells are arranged according to the magnitude of response to quinine. No cells responded to 0.5 mm sucrose octaacetate or 10 mm caffeine.

