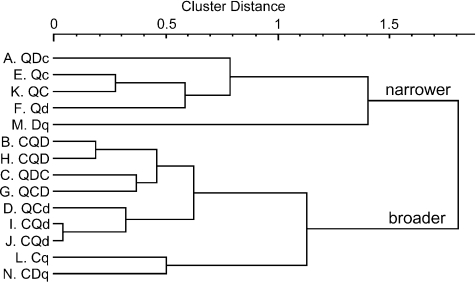
Figure 6. Cluster dendrogram showing the relationships among response profiles of bitter sensitive taste cells.
The cell number and response profile of each cell is indicated on the left (Q or q: quinine, D or d: denatnium, C or c: cyclohexamide). The two clusters are labelled narrower and broader according to the breadth of responsiveness to three bitter compounds. The mean entropy of the breadth of responsiveness for the narrower and broader cluster is 0.577 ± 0.1 (n= 5) and 0.907 ± 0.053 (n= 9), respectively, which differ significantly (P < 0.01, t-test).

