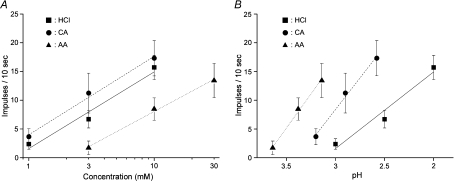
Figure 12. Concentration–response and pH–response relationships for HCl, citric acid and acetic acid.
A, concentration–response relationships for HCl (squares), citric acid (CA: circles) and acetic acid (AA: triangles) (n= 6∼21). B, pH–response relationships for HCl, citric acid and acetic acid (n= 6∼21). Values indicated are means ±s.e.m.

