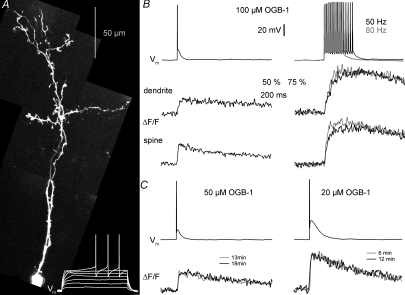
Figure 1. Fluorescence transients ΔF/F in granule cells in response to single-current-evoked APs and AP trains. Fast equilibration.
A, two-photon scan of a granule cell filled with 100 μm OGB-1 and somatic voltage recordings of this cell's response to 500 ms depolarizing pulses (white traces at the bottom). Scaling of the voltage trace similar to traces in B. B, somatic voltage recordings and corresponding averaged fluorescence transients ΔF/F imaged in line-scan mode across the proximal dendrite and a spine of the cell shown in A. The decay half-duration τ1/2 was 650 ms in the dendrite and 430 ms in the spine. Left, responses to single APs (ΔF/F)AP; on the right, responses to trains of 15 APs at 50 and 80 Hz, all evoked by somatic current injection. Scaling of all traces as indicated by the bars; note the condensed scaling of the ΔF/F responses to AP trains. C, examples of averaged (ΔF/F)AP responses from two other granule cell dendrites, filled with 50 μm and 20 μm OGB-1 respectively, and recorded at the indicated times after break-in. Scaling of the voltage recordings and (ΔF/F)AP transients similar to above.

