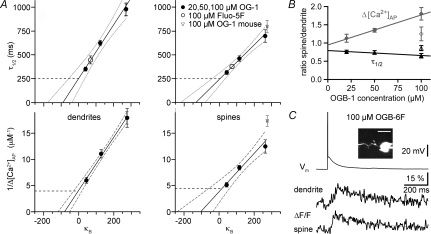
Figure 2. Extrapolation to conditions of 0 added buffer for granule cell dendrites and spines; data with low-affinity dye.
A, upper graphs: extrapolation of decay half-duration data versus exogenous buffering capacity κB in dendrites and spines; lower graphs: inverse of absolute change Δ[Ca2+] per single somatic AP. Continuous lines, linear fit; dotted lines, 2σ confidence interval; dashed lines, 1σ confidence interval. These intervals do not account for the uncertainty in the data points themselves. All error bars represent s.e.m. The errors in x-direction (s.e.m. of mean κB) are very small and thus not visible. B, relation of spine to dendrite Δ[Ca2+]AP (grey filled diamonds) and of τ1/2 (black filled triangles) of individual pairs of spines and their parent dendrites versus the concentration of OGB-1 (9 pairs for each data point). The open symbols represent data from mouse (16 pairs). The lines represent linear fits of the rat data, the error bars again represent s.e.m. C, representative data for the low-affinity dye OGB-6F. About 20 averaged traces for ΔF/F. The decay half-duration was τ1/2≈ 200 ms for the dendrite and τ1/2≈ 240 ms for the adjacent spine. The inset shows a scan of the respective granule cell with the scale bar corresponding to 10 μm; the data shown were recorded from the upper spine next to the GC soma.

