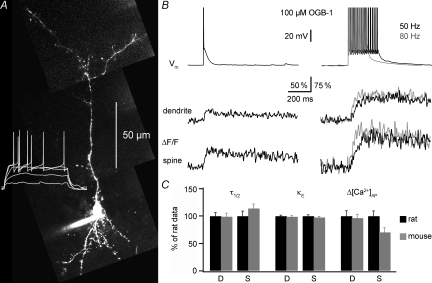
Figure 3. Ca2+ handling in mouse granule cells.
A, two-photon scan of a mouse granule cell (PND 36) filled with 100 μm OGB-1 and somatic voltage recordings of this cell's reponse to 500 ms depolarizing pulses (white trace). Scaling of the voltage trace similar to traces in B. B, somatic voltage recordings and simultaneous fluorescence transients ΔF/F imaged in line-scan mode across the proximal dendrite and a spine of the cell shown in A. Depiction as in Fig. 1B. C, comparison between mouse and rat data for dendrites (D) and spines (S); all using 100 μm OGB-1. The rat data were normalized to 100%. The mouse data are shown as relative fractions and included 24 GCs of mice aged PNDs 16–43.

