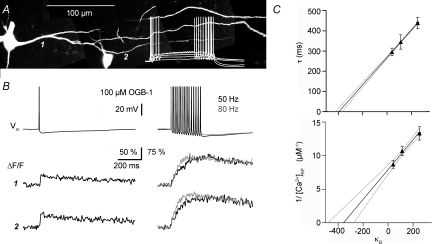
Figure 4. Ca2+ handling in juvenile rat mitral cells. Extrapolation to conditions of 0 added buffer.
A, two-photon scan of rat mitral cells (PND 14) filled with 100 μm OGB-1 and somatic voltage recordings of the left cell's reponse to 500 ms depolarizing pulses (white trace). Scaling of the voltage trace similar to traces in B. B, somatic voltage recordings and simultaneous fluorescence transients ΔF/F imaged across the lateral dendrite shown in A, at the positions labelled 1 and 2. Depiction as in Fig. 1B. C, data points from recordings with 20, 50 and 100 μm OGB-1. Upper graph: extrapolation of decay half-duration data vs. buffering capacity κB in mitral cell lateral dendrites. Lower graph: inverse of absolute Δ[Ca2+] per single somatic AP. Continuous lines, linear fit; dotted lines, 2σ confidence interval; dashed lines, 1σ confidence interval. These intervals do not account for the uncertainty in the data points themselves. All error bars represent s.e.m. The errors in x-direction (s.e.m. of mean κ) are very small and thus barely visible.

