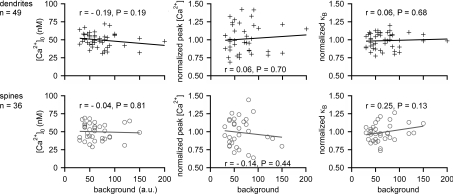
Figure 5. Influence of background levels on [Ca2+]0, peak [Ca2+] and κB.
Measurements of [Ca2+]0, peak [Ca2+] and κB for OGB-1 in individual locations in GC dendrites (upper row) and spines (lower row) versus the fluorescence background measured next to these locations. The lines indicate the linear fits, r the Spearman correlation coefficient and P the significance of the difference between the determined r and r= 0 (no correlation). The shown data include all GC OGB-1 measurements at 20, 50 and 100 μm; to heighten the sensitivity to possible correlations, peak [Ca2+] and κB were normalized to their average value at the concentration at hand and pooled.

