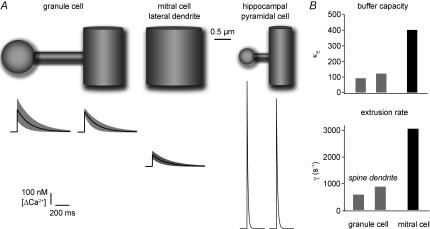
Figure 6. Estimated average Ca2+ dynamics under physiological conditions in granule cells, mitral cell lateral dendrites and hippocampal CA1 cells.
This figure illustrates the estimated mean dimensions and the extrapolated Ca2+ dynamics of the investigated structures (GC spine and dendrite, MC lateral dendrite; Tables 1 and 2) and a spine on a fine hippocampal pyramidal cell dendrite for comparison. The olfactory bulb anatomical data were in part taken from Woolf et al. (1991a; see Methods and Results). The hippocampal data were taken from Harris & Stevens (1989) and Sabatini et al. (2002; their Table 1), respectively. The black traces show the mean Ca2+ transient, the grey band denotes the s.d. with respect to Δ[Ca2+]AP and τ. B shows the extrapolated buffering capacities and extrusion rates for GC spines and dendrites and MC lateral dendrites under physiological conditions.

