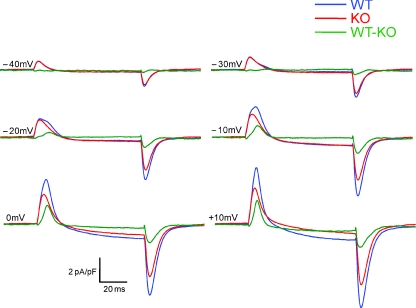
Figure 5. Average recordings of WT (blue) and KO (red) fibres plotted in time with average difference records (green).
Note virtually identical charge movement recordings at −40 and −30 mV steps, followed by development of delayed, steeply voltage dependent hump component (Qγ) suppressed in KO fibres. At steeper depolarizations this component shifts back earlier in time and saturates in area.

