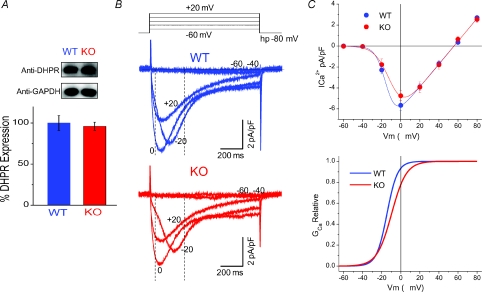
Figure 8. L-type Ca2+ current density, voltage dependence and channel expression are not significantly changed in KO fibres.
A, representative Western blots with anti-α1s from lysates of WT and S100A1−/− muscle show similar DHPR expression, with GAPDH used as a loading control. The bar graph is the result of triplicate experiments in WT and KO muscle, showing that the expression of the DHPR is not altered with the ablation of S100A1. Data are presented as a percentage of the average WT DHPR expression, normalized to the GAPDH signal. B, representative macroscopic Ca2+ current recordings of WT (blue) and KO (red) fibres. In these experiments Cd2+ and Co2+ were eliminated from the external solution and Ca2+ was increased to 2 mm. Vertical dashed lines illustrate the time used to measure peak current values to create the I–V plots. C, top, I–V relationship of average data from WT and KO fibres reveals no significant differences in L-type channel current density and voltage dependence. The data are fitted to a Boltzmann-Ohm function. At bottom is the activation profile of WT and KO fibres derived from parameters of a Boltzmann-Ohm function. These results suggest that suppressed charge movement in KO fibres is not linked to changes in L-type Ca2+ channel expression and voltage-dependent activation.

