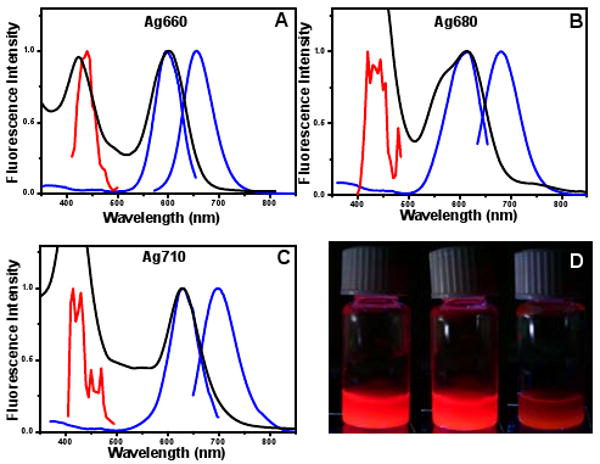
Figure 1.

(A) OPE fluorescence and excitation (blue), TPE (red) spectra, and absorption spectra (black) of 660nm emitting species created in 5′-CCCATATTCCCC-3′. (B) 680nm emitting species created in 5′-CCCTATAACCCC-3′. (C) 710nm emitting species created in 5′-CCCTAACTCCCC-3′. (D) Picture showing from left to right the OPE emission of the 660, 680, and 710nm species
