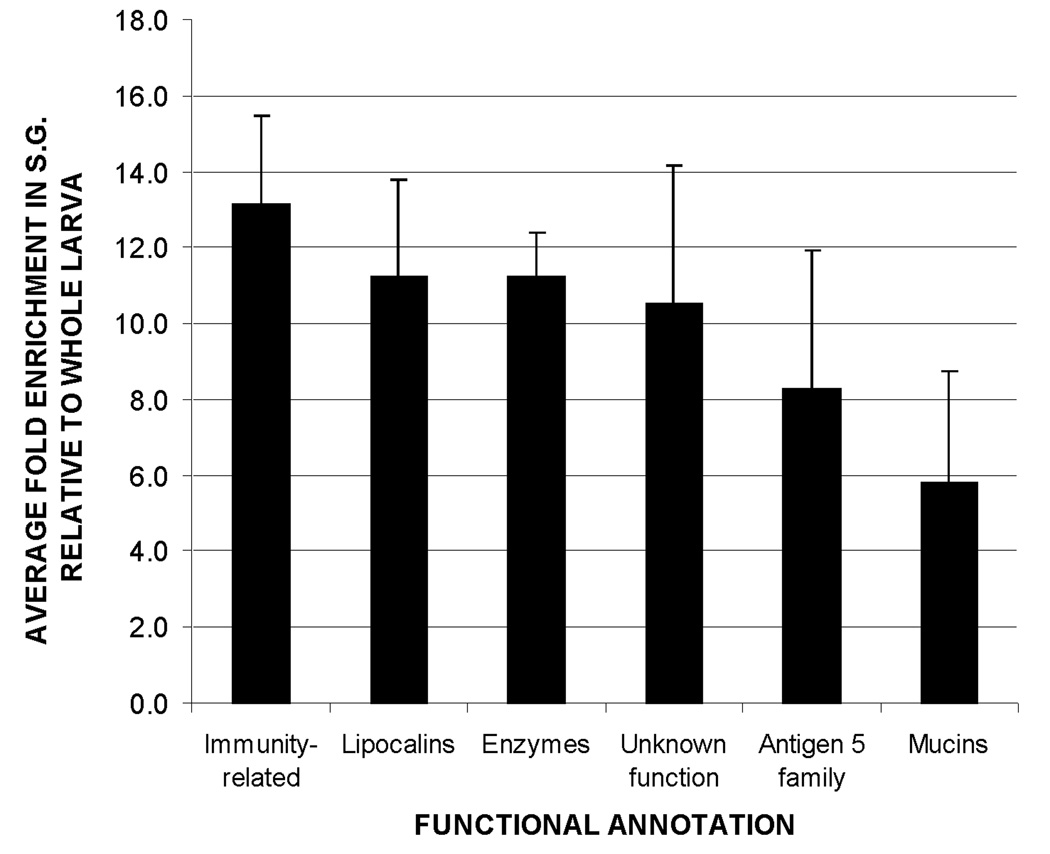
Fig. 4.
Relative abundance of transcripts associated with putative secreted proteins, grouped by functional annotation. Transcripts associated with immune functions were the most abundant, followed by lipocalins and digestive/detoxifying enzymes. Bar height represents the mean enrichment of transcripts within each functional group. Error bars show the standard error of the mean.

