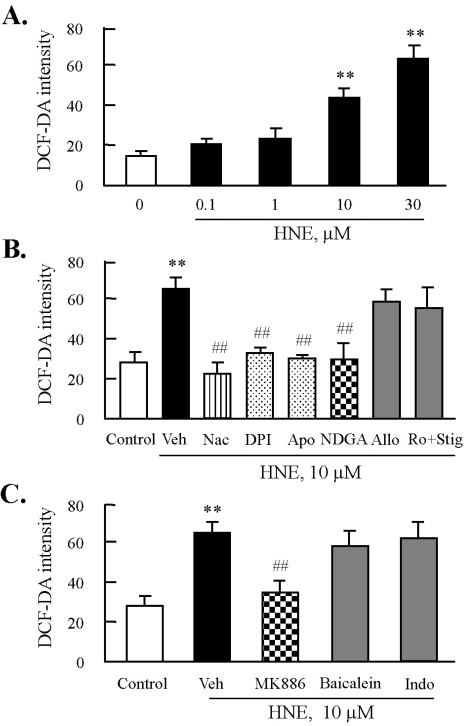
Fig. 3.
Effects of inhibitors of NADPH oxidase or lipoxygenase on HNE-induced ROS production in J774A.1. macrophages. (A) Cells were treated with different concentrations of HNE for 45 min, and then ROS generation was measured by flow cytometry (FACS) using DCF fluorescence. Fluorescence intensity was analyzed by CellQuest Software. Data was presented as mean±SE from 5 independent experiments. **p<0.01 vs. value at concentration 0. (B) Cells were incubated with 10 µM HNE for 45 min after pre-treatment with various inhibitors for ROS including N-acetylcysteine (Nac, 5 mM), diphenylamine iodonium (DPI, 10 µM), apocynine (Apo, 300 µM), nordihydroguaiaretic acid (NDGA, 10 µM), allopurinol (Allo, 100 µM), or rotenone (Ro, 1 µM) plus stigmatellin (Stig, 1 µM) for 30 min. (C) Cells were pre-treated with eicosanoid inhibitors including MK886 (10 µM), baicalein (10 µM), or indomethacin (Indo, 100 µM) for 30 min, and then stimulated with 10 µM HNE for 45 min. ROS generation was analyzed by FACS. Data was presented as mean±SE from 5 independent experiments. **p<0.01 vs. control; ##p<0.01 vs. veh (vehicle).

