Fig. 2.
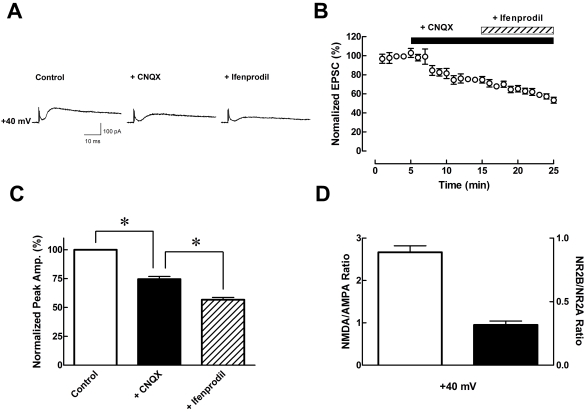
Pharmacological isolation of NMDA receptors. (A) Sample traces of EPSCs with continuously added specific antagonist such as CNQX (AMPA receptor antagonist, 10 µM), and ifenprodil (NMDA receptor subunit NR2B blocker, 3 µM), respectively. (B) Plot graph shows baseline, addition of CNQX, and ifenprodil by 10 min interval, tendency decreased EPSCs by CNQX, and ifenprodil (n=6). (C) Bar graph shows average peak data normalized to control (open bar) currents. *p<0.05, when compared to control versus CNQX and CNQX versus ifenprodil. (D) Bar graph shows NMDA/AMPA ratio and NR2B NMDA receptor subunit/NR2A NMDA receptor subunit ratio calculated by data from Fig. 2C. Data are expressed as mean±S.E.M..

