
Figure 5.
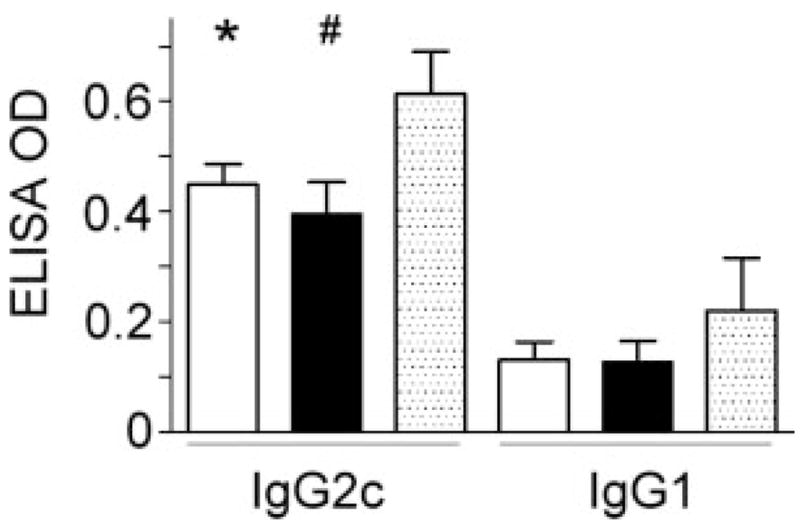
H. pylori-specific IgG2c and IgG1 levels in H. pylori-infected mice. At 32 WPI, there was no difference in IgG2c levels among gulo−/− mice supplemented with low vitamin C (white bar) and high vitamin C (black bar). Gulo−/− mice supplemented with low or high vitamin C had lower IgG2c levels than did C57BL/6 (WT) mice (dotted bar) but differences were significant only for gulo−/− mice supplemented with low vitamin C (*, p < 0.05). IgG1 levels among these 3 groups of mice were low and similar at 32 WPI (p = 0.44).