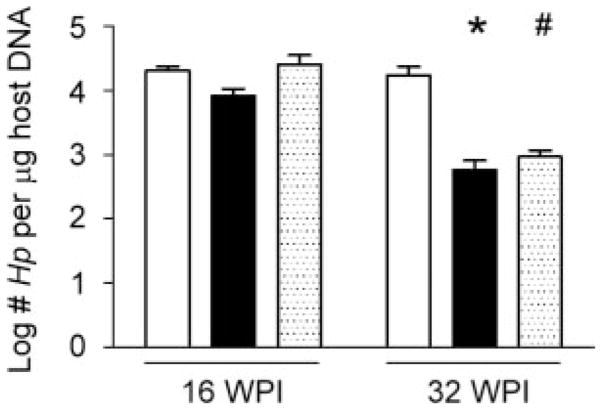
Figure 6.
H. pylori(Hp) colonization levels (log CFU/μg host DNA). At 16 WPI, there were no differences in H. pylori colonization levels across groups. At 32 WPI, gulo−/− mice supplemented with low vitamin C (white bars) had higher H. pylori colonization levels than gulo−/− mice supplemented with high vitamin C (black bars) and C57BL/6 (WT) mice (dotted bars). (*, p < 0.05; #, 0.05 < p < 0.10).

