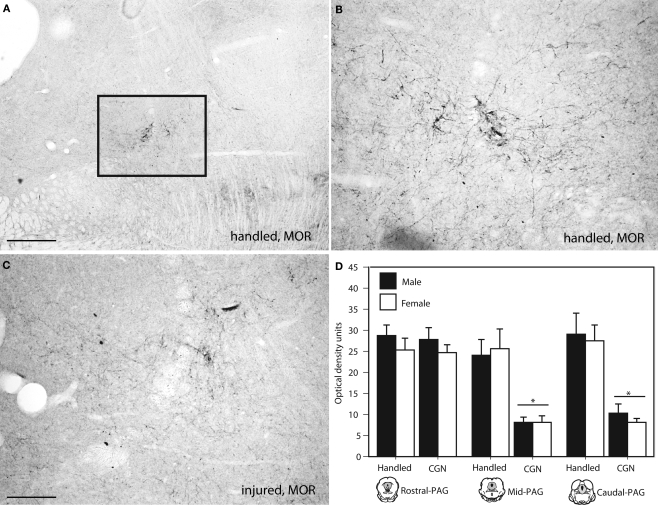
Figure 6.
Photomicrograph depicting representative examples of MOR-ir in the PAGl/vl in adult rats following neonatal treatment. (A) handled, 4×, (B) handled, 10×, (C) 1% carrageenan, 10×. (D) At mid and caudal levels of PAG, CGN animals expressed significantly lower MOR-ir compared to handled animals. N = 6–8 rats per group/per sex. * denotes significant main effect of treatment. Error bars represent SEM.

